‘git log’ Graphing
Recently I’ve become responsible for a large project with lots of branches and a complex history I frequently need to dig into. I prefer to work on the command line, so ended up exploring various git log options.
I haven’t found a good write-up of these, so here is my attempt at sharing one with you.
tl;dr
I use this alias everywhere:
alias gitgraph="git log --graph --oneline --all --decorate --topo-order"
git log
In case you’re not familiar with it already, the command to show the history from your current point is:
git log
The output is most-recent commit first, down to the oldest.

–oneline
Most of the time I don’t care about the author or the date, so in order that I can see more per screen, I use –oneline to only show the commit id and comment per-commit.
git log --oneline
–graph
The problem with the above is that you only see a linear series of commits, and get no sense of what was merged in where. To see this aspect of the history use –graph.
git log --oneline --graph
You can see where merges take place, and what commits were merged.
–all
By default you only get the history leading up to the HEAD (ie where you are currently in the git history. Often I want to see all the branches in the history, so I add the –all flag.
git log --graph --oneline --all

–decorate
That’s great, but I can’t see what branch is where! This is where you use –decorate.
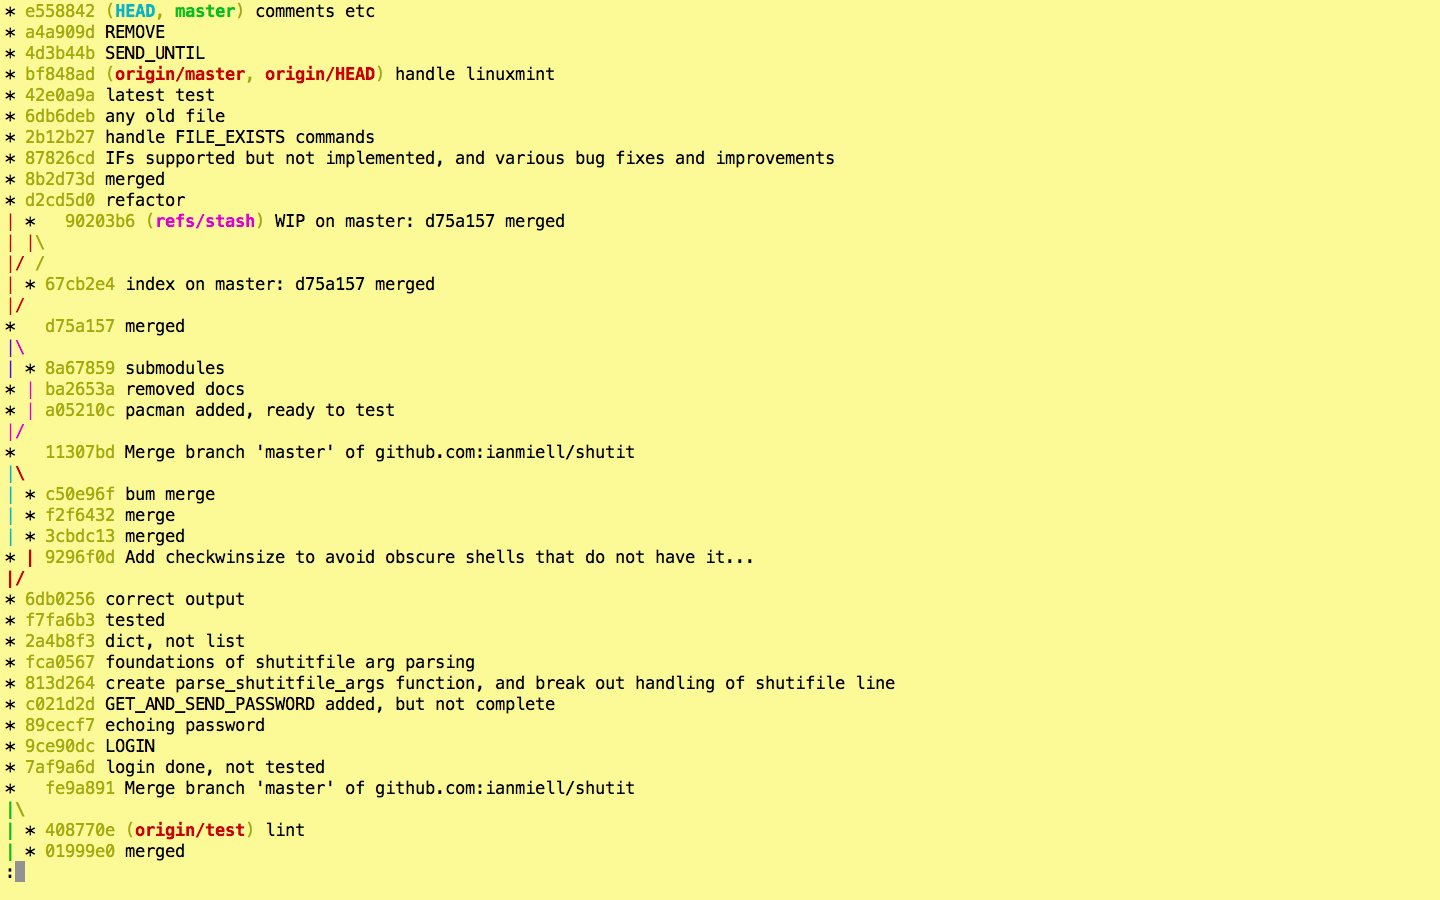
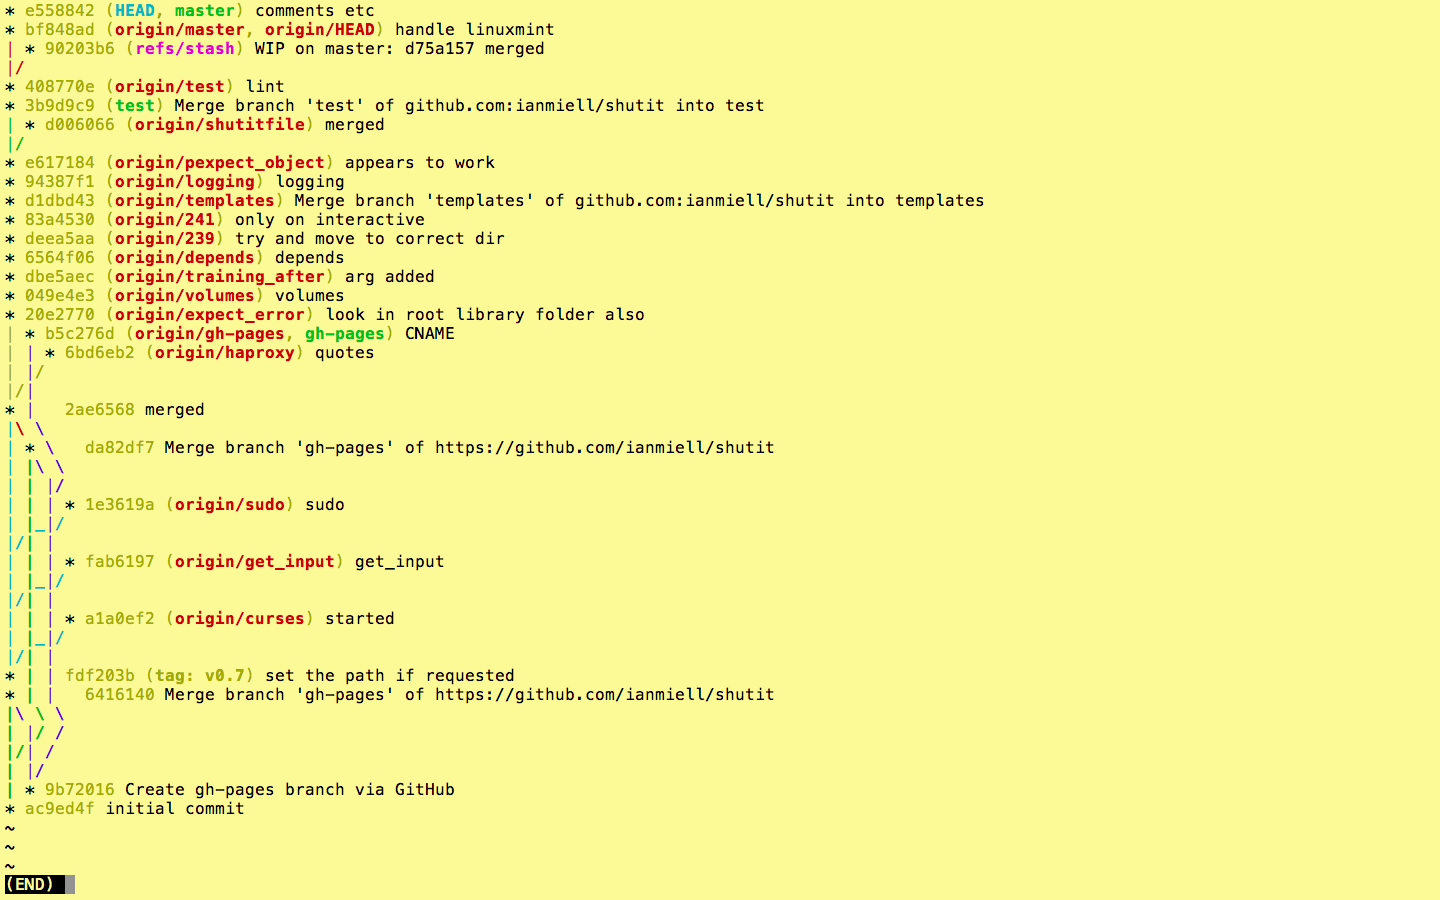
git log --graph --oneline --all --decorate

Now we’re cooking with gas! Each remote or type of branch/tag is shown in a different colour (even stashes!). On my terminal, remotes are in red, HEAD is blue, local branches are in green, stashes in pink.
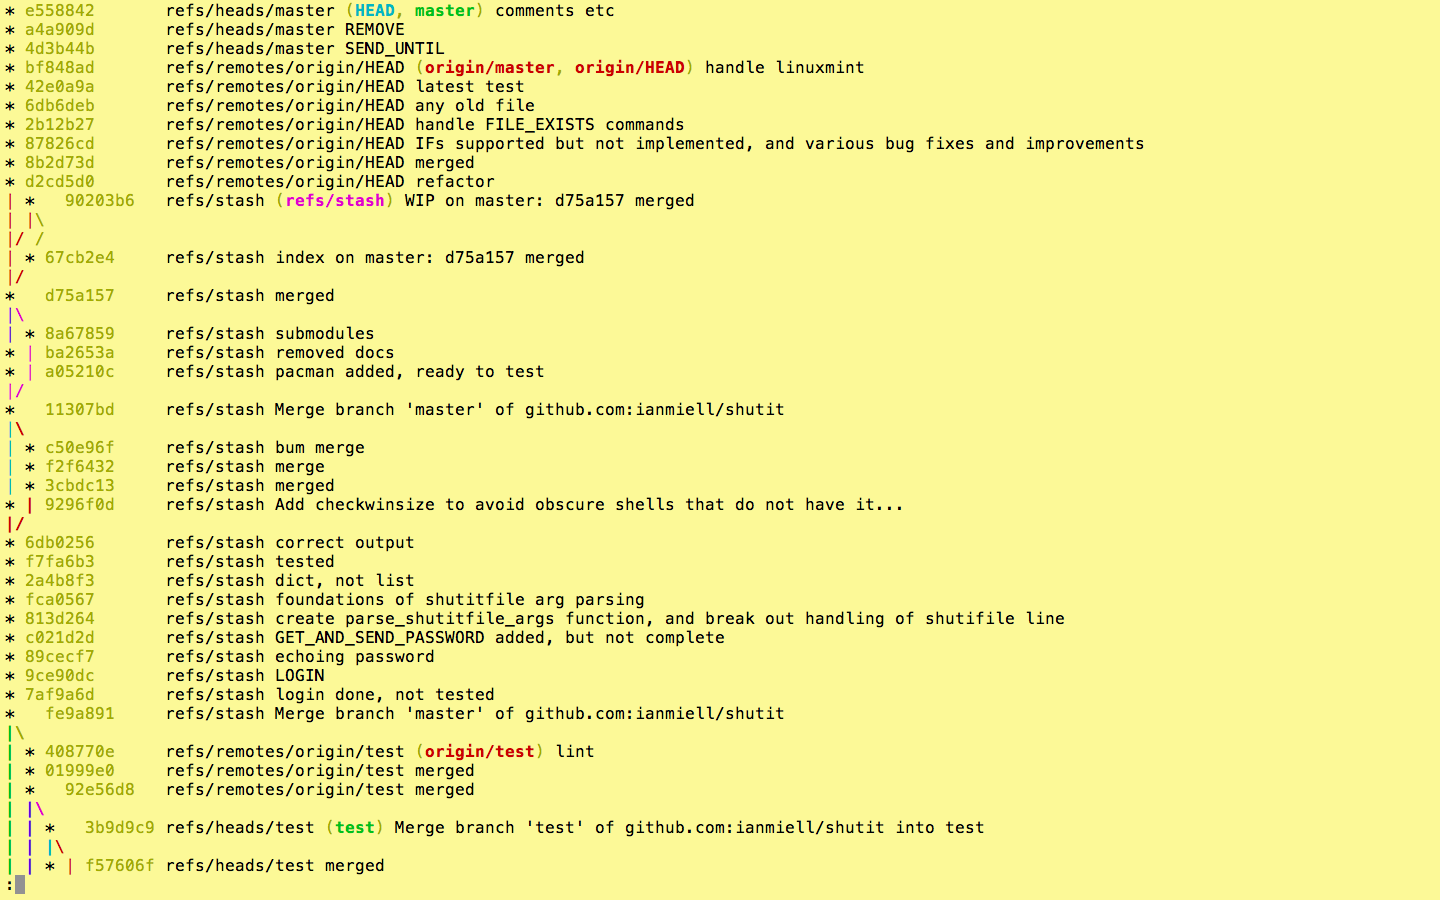
If you want, you can show the ref name on each line by adding –source, but I usually find this to be overkill:
git log --graph --oneline --all --decorate --source
–simplify-by-decoration
If you’re looking at the whole history of your project, you may want to see only the significant points of change (ie the lines affected by –decorate above) to eliminate all the intermediary commits. This is perfect for getting an overview of the project as a whole.
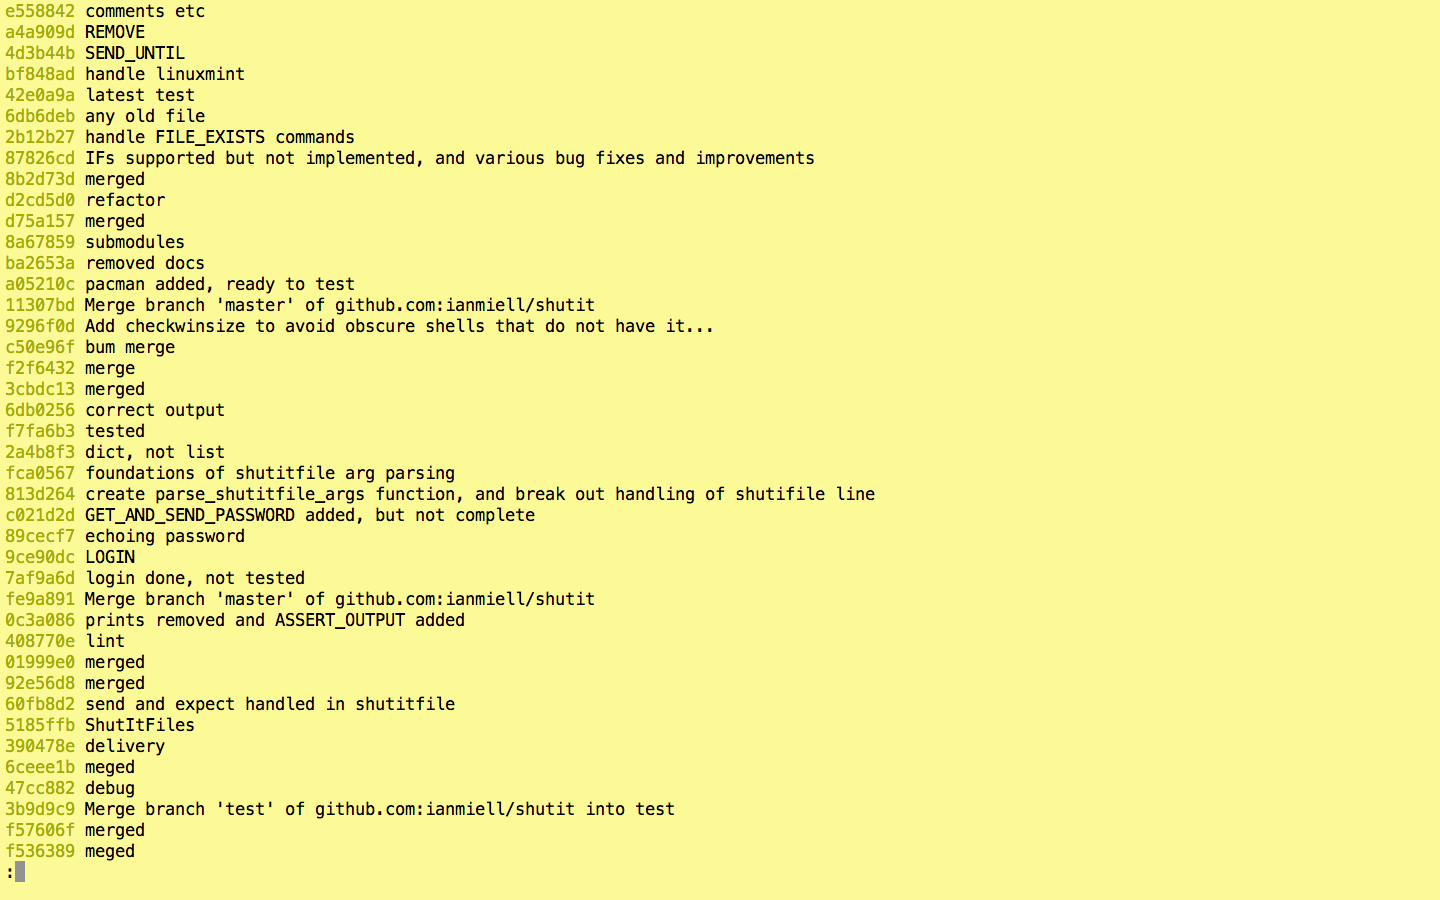
git log --graph --oneline --all --decorate --simplify-by-decoration
–pretty
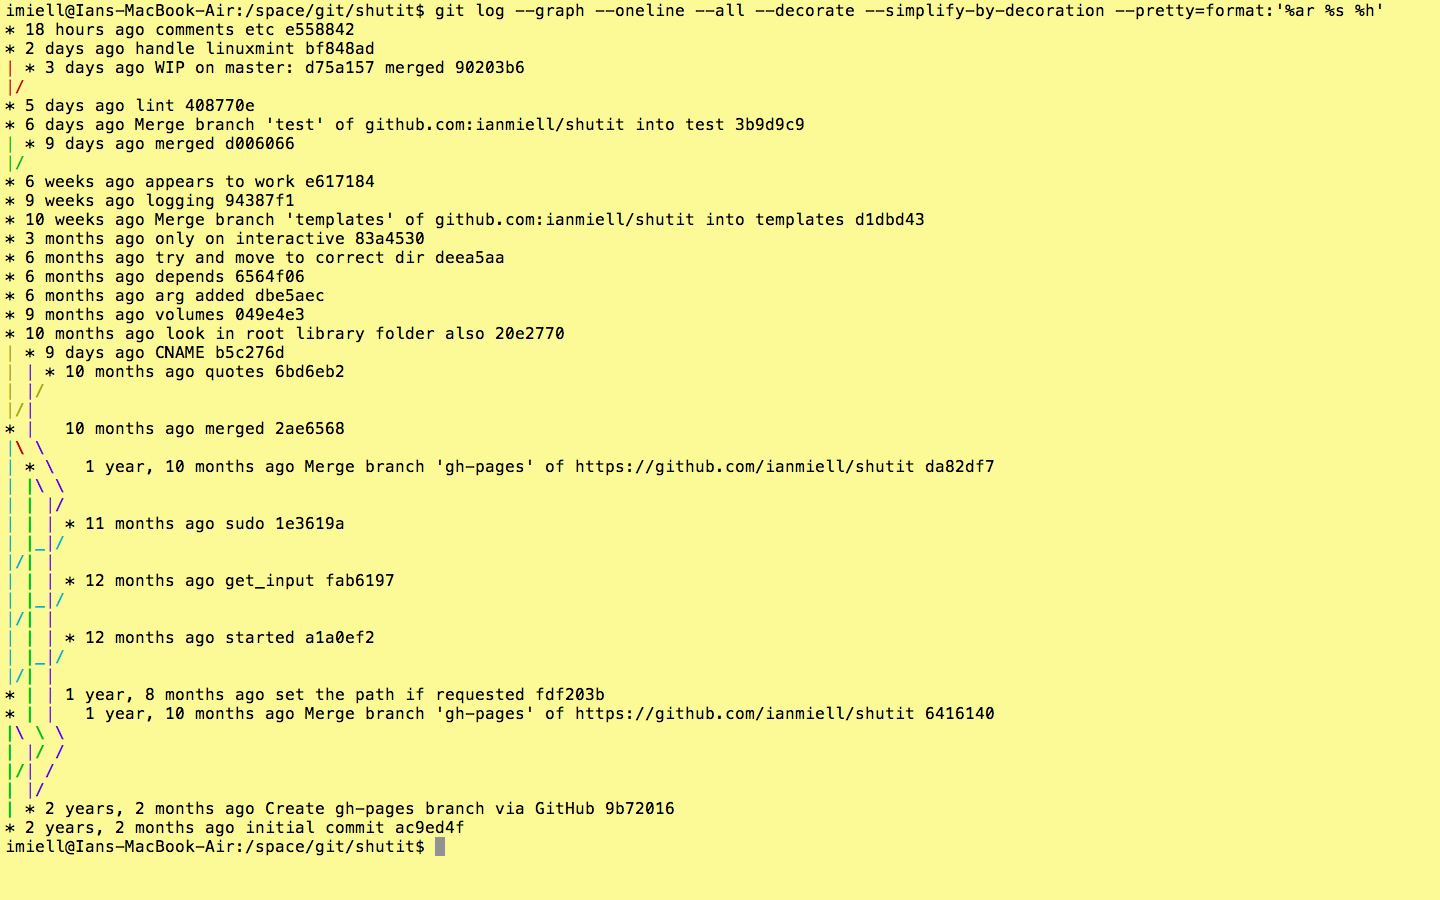
When viewing the whole history of the project in this way, you might want to re-introduce the Date info with –pretty=
git log --graph --oneline --all --decorate --simplify-by-decoration --pretty='%ar %s %h'
This gives a formatted output, showing (in this case) the relative timestamp (%ar), the commit subject (%s), and the short hash (%h).
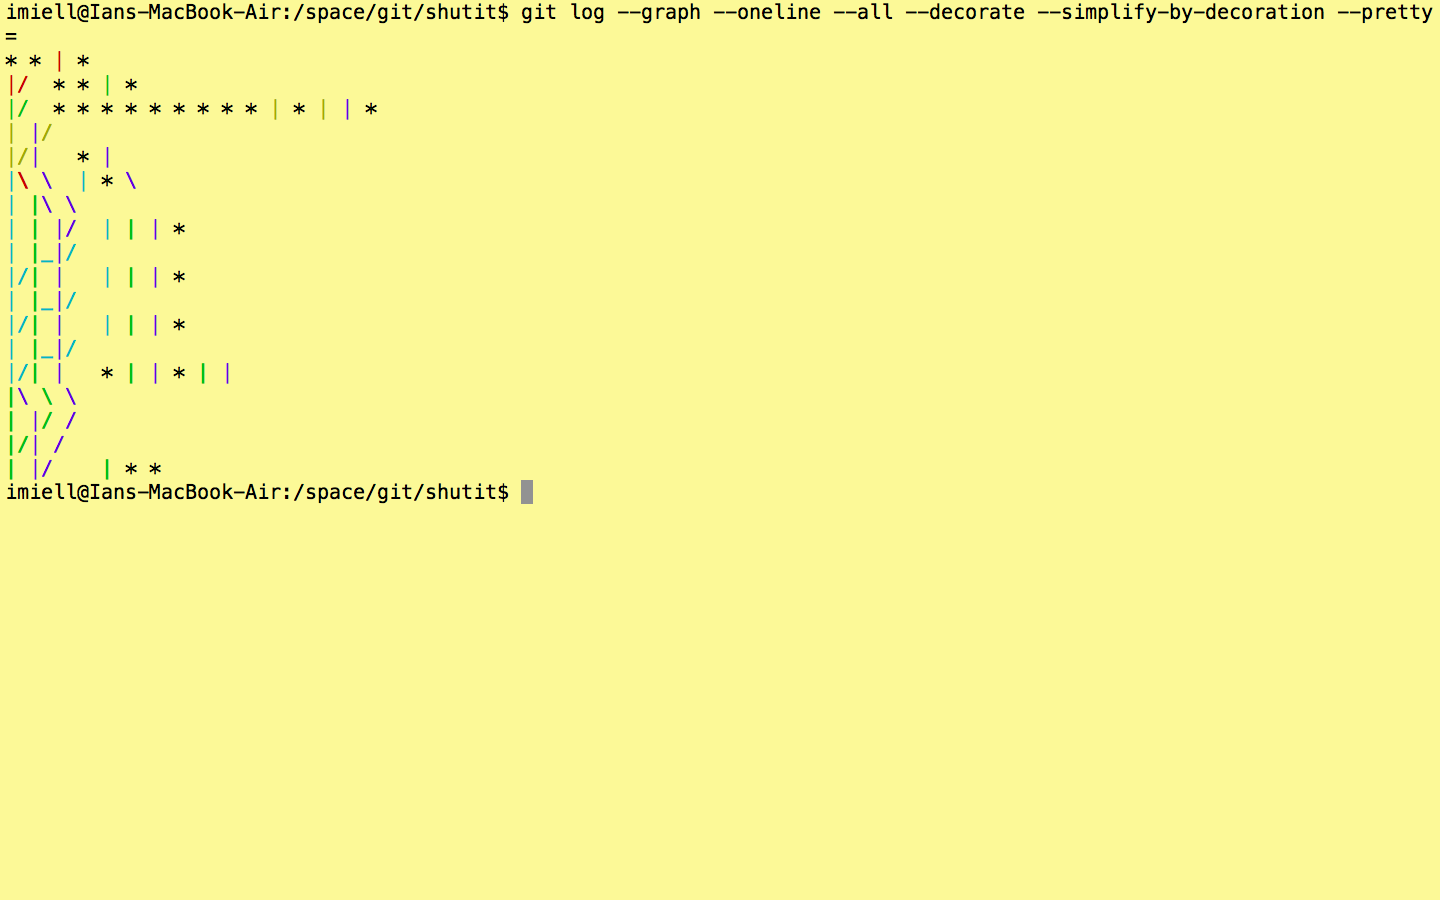
You can even see the abstract shape of the git repo!
git log --graph --oneline --all --decorate --simplify-by-decoration --pretty=
–topo-order
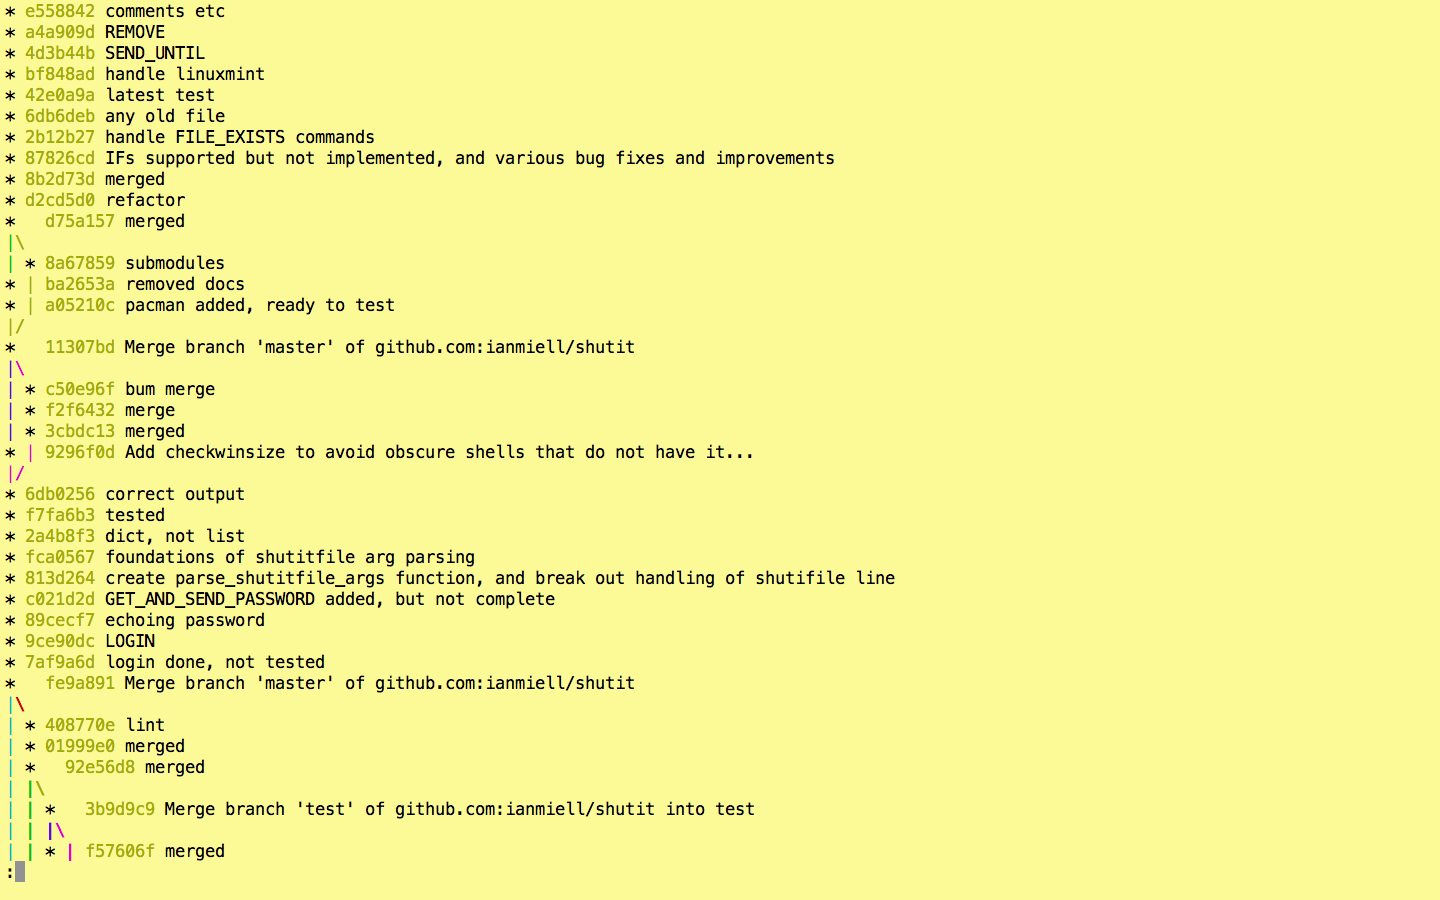
The order in which commits are displayed. Although it appears to be the default, it’s worth knowing that –topo-order shows commits ‘bunched together’ by topic, rather than in date order. This leads to easier-to-read graphs in complex projects.
git log --graph --oneline --all --decorate --topo-order
Other options include –date-order and –reverse.
Strangely, you can’t use –graph with –reverse, but you can do this:
git log --graph --oneline --all --decorate --simplify-by-decoration | tac
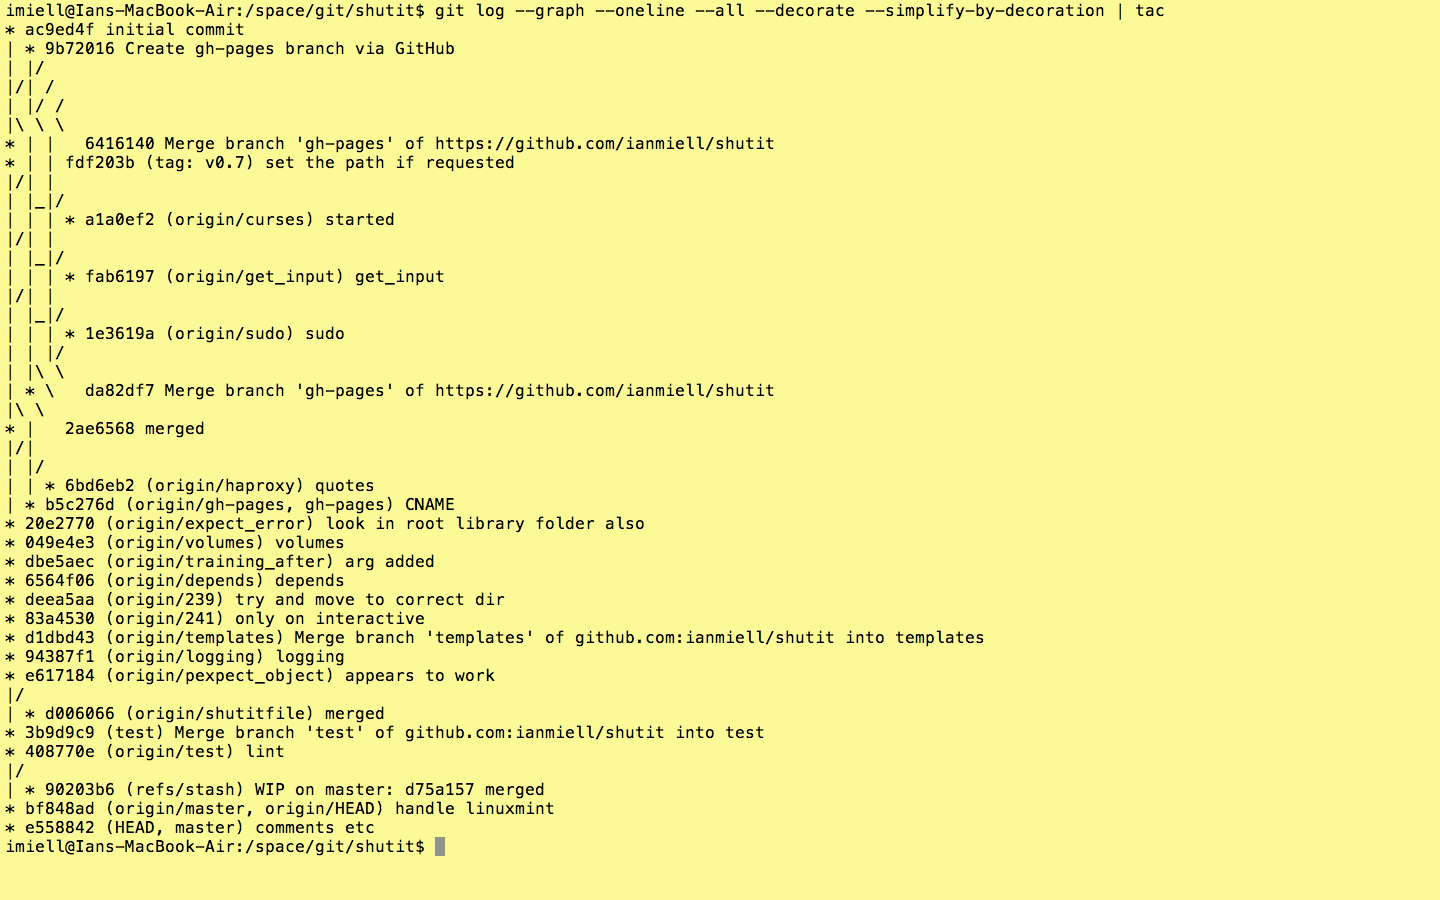
To show commits from oldest to newest.
(tac is available in the coreutils package – see here for mac)
This is based on work in progress from the second edition of Docker in Practice
Get 39% off with the code: 39miell2

Reblogged this on dq2nd.